Car seats have a very complex structure. They consist of frames, supporting structures such as springs and beams, heating or even cooling systems, back and seat cushions, etc. The latter are made of polyurethane foams, which can possess different degrees of hardness. For example, sometimes it is desirable to use different types of foam in the middle and side parts of the cushions. Due to the complexity of the seat construction, the reactive injection moulding process is very difficult to implement. Our FOAM solver simulates the expansion process of PU foams in any geometry and offers the possibility to pre-calculate foam formation and resulting foam density in closed molds.
Simulation of PU Foam Expansion in Car Seat Manufacturing
Project Result in Cooperation With Fehrer Automotive, Audi and Fraunhofer ITWM
Tabbed contents
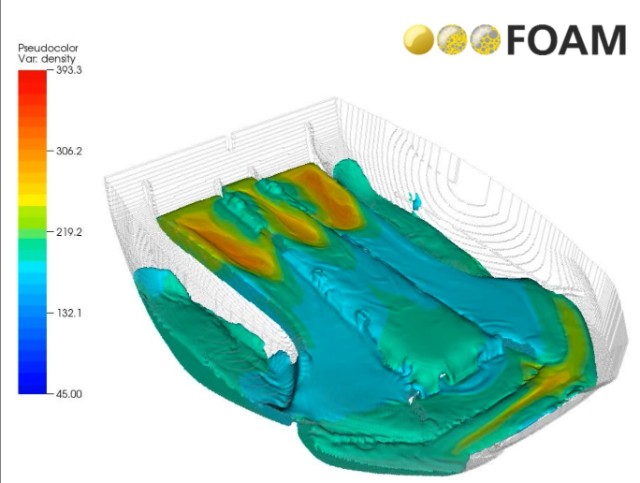
Car Seats Made of PU Foam in an Open Mold
Privacy warning
With the click on the play button an external video from www.youtube.com is loaded and started. Your data is possible transferred and stored to third party. Do not start the video if you disagree. Find more about the youtube privacy statement under the following link: https://policies.google.com/privacySimulation of PU Foam Expansion in Car Seat Manufacturing: Foam is poured into open mold. © Fraunhofer ITWM
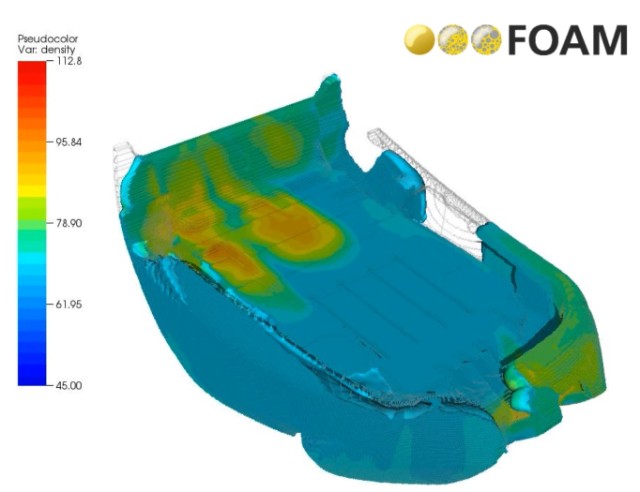
Car Seats Made of PU Foam in an Closed Mold
Privacy warning
With the click on the play button an external video from www.youtube.com is loaded and started. Your data is possible transferred and stored to third party. Do not start the video if you disagree. Find more about the youtube privacy statement under the following link: https://policies.google.com/privacySimulation of PU Foam Expansion in Car Seat Manufacturing: The foam expands further after the mould is closed. © Fraunhofer ITWM
The Steps to an Optimal Foaming Process
The process alone can be divided into the following steps: First, the material is injected into the open mold. During this process the foam already starts to expand.
Then the mould is closed and sometimes tilted to allow the foam to flow in a certain direction by exploiting force of gravity. In the closed mold, the foam continues to expand until it fills the entire cavity.
The injection phase is realized by predefined injection paths and the amount of injected material. In this phase, it is very important to select the proper amount of material to achieve a uniform foam density at the end of the process.
Simulation Tool Foam Also Supports Venting in the Process
Attention has to also be paid to the fact that the foaming process releases carbon dioxide. The gas excess is removed from the mold by venting. The arrangement of the vents through which the gas can escape from the closed mold becomes a crucial issue. A wrong arrangement of the vents can lead to gas bubbles or even to large unfilled cavities. All these important issues can be handled with the simulation tool FOAM.

Project Objective and Cooperation: From Experiment to Simulation
The aim of the project between Fehrer Automotive, Audi and our institute was to validate the capabilities of the simulation tool FOAM with respect to the prediction of polyurethane foam expansion in both simplified cavities and in a real car seat geometry. The latter was provided by Audi. All experiments were conducted by Fehrer Automotive.
At the beginning of the project, two foam systems were selected. For each system, Fehrer Automotive conducted simplified foam expansion experiments that provided information about the temporal volumetric expansion and the temporal development of the foam temperature. A certain amount of foam raw material was injected into a cylindrical tube (see Figure 1) and both the foam height at the central line and the foam temperature at the sensor position 5 cm from the bottom were measured. These data were a starting point for the identification step of the input parameters of the FOAM model. On this basis, we calibrated the model input data to match the experiments. In Figure 1, we show comparison between experimental data and simulation results of the height in the middle and the temperatures at sensor position.
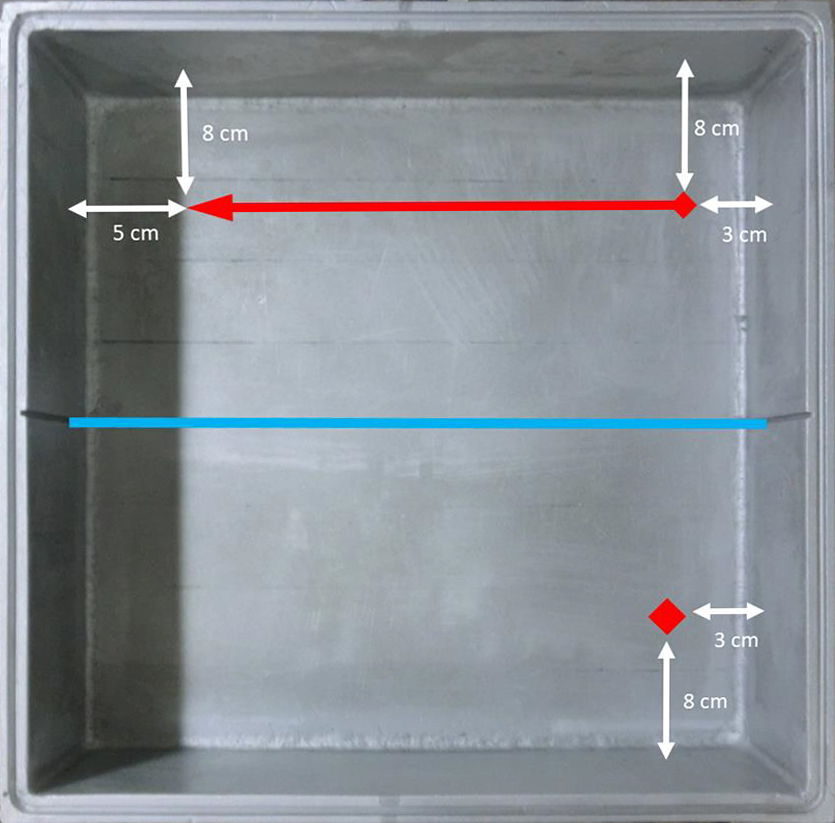
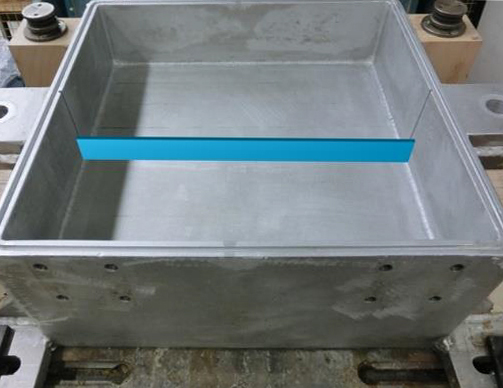
After successful model calibration, validation tests were performed in a simplified cavity (Figure 2a). Different configurations with and without blade insert, with and without cavity inclination were tested. In all cases, a certain amount of material was injected into the open cavity. Either a point or a line pour pattern was selected (Figure 2b, marked with red color). The mold was closed with a transparent lid after the shot. We filmed the foam expansion with a camera. Thus the development of the foam front could be used to validate the simulation results.
Simulation and Experiment Line-Point Pouring Paths
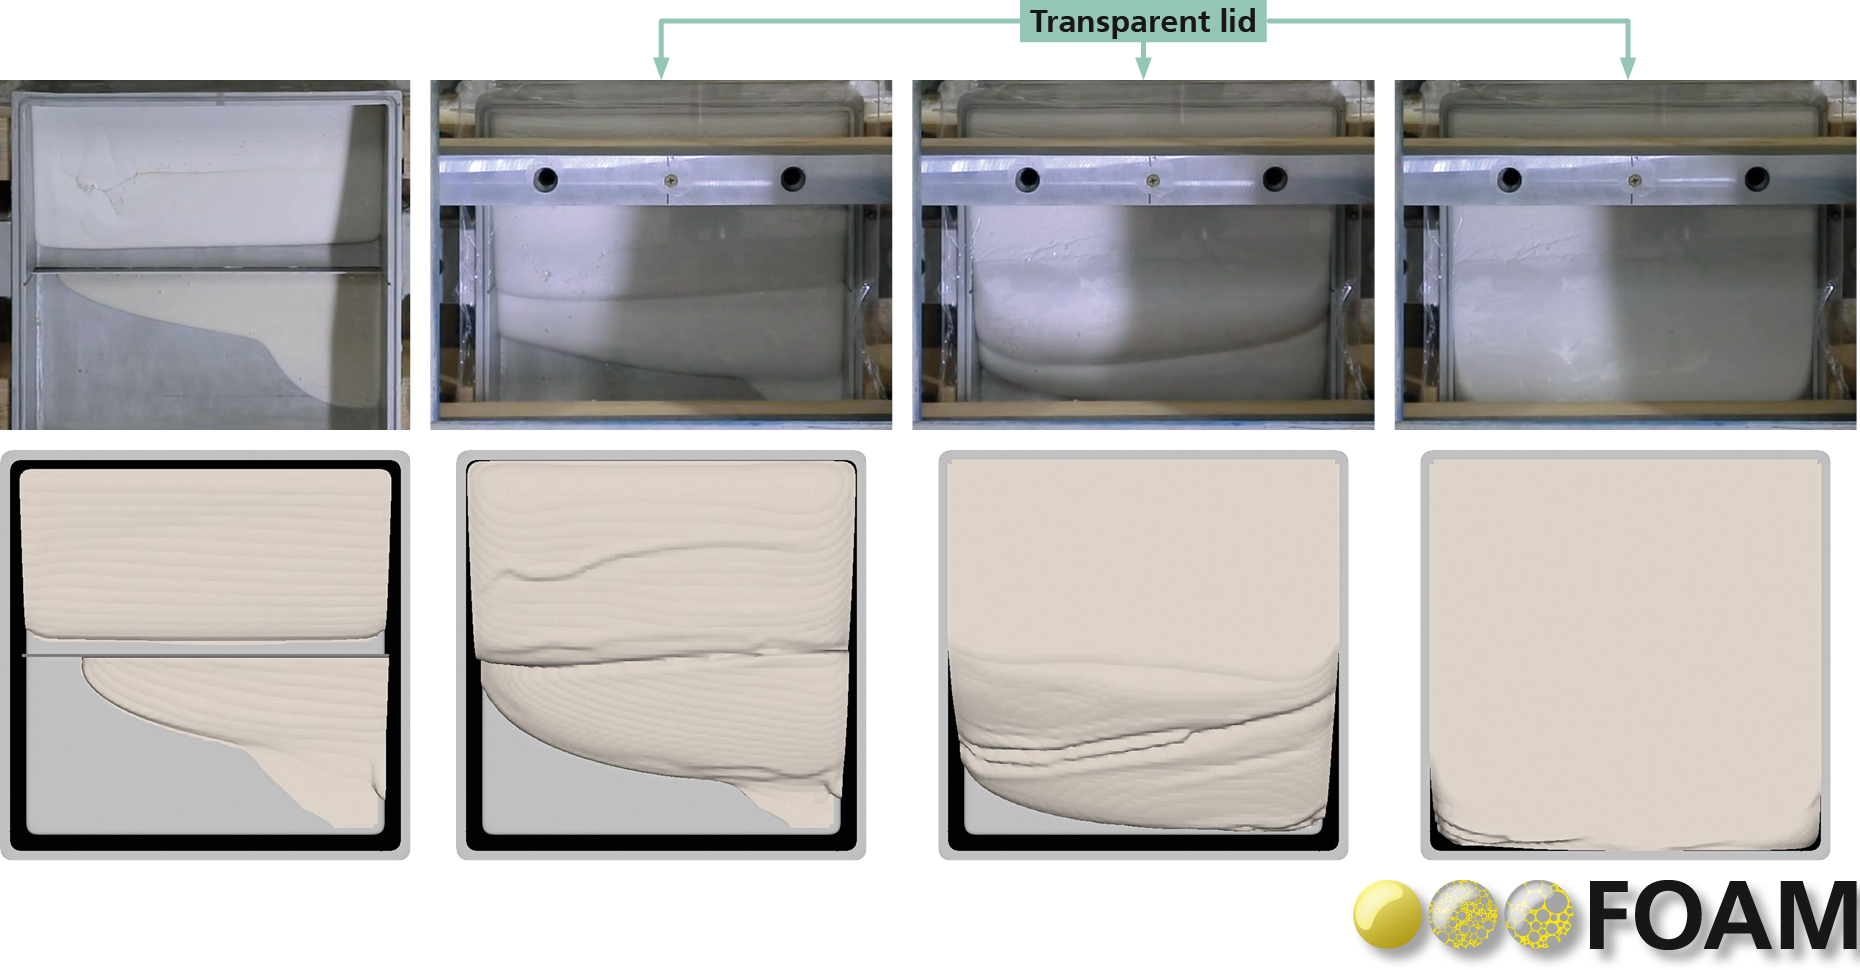
In Figure 3 comparison of simulation and experiments for a line-point pouring paths are presented. The cavity was inclined by 10° and the material was injected along the line path first. Later followed the injection in a lower left (Figure 2b) point position. After the line-path fill, foam covers fully the cavity part between the blade insert and the front wall. In the other cavity part, due to 10° inclination, foam flows in the direction of the insert first. After that, foam expands further and spreads into the left cavity wall (Figure 3, left plot). The foam from the upper cavity part overflows the insert and touches the upper transparent lid.
In the experiment as well as in the simulations the clear foam front line between the materials poured into the upper and lower part of the cavity is detected (Figure 3, middle diagrams). The foam expands further, filling the space between the bottom and the transparent lid, flows towards the rear wall of the cavity and finally fills the cavity completely (Figure 3 right picture). In this case, the venting takes place through the lateral slits between the transparent lid and the cavity walls.
Car Seat Geometry: Foam Saves Trials, Money and Time
Figure 4 shows a real car seat geometry provided by Audi. In this case two foam systems were used. Softer foam was injected in the central cavity part, while a harder foam system was used in the side areas of the seat. The figure in the upper right shows schematically the pouring material paths. The process started with the injection of foam into the open cavity, after a certain time the mold was closed and at the same time the rear mold part was raised by 3°. The air trapped in the closed mold and the carbon dioxide produced during the expansion process were released through the vents as well as through the split line along the edge between the lower and upper mold parts. The foam for each injection shot was colored in separate experiments to track the final foam position from different pouring paths. However, in the laboratory it was not possible to isolate the colored parts clearly between the different shots, therefore slight deviations are possible. In FOAM we have used markers to track the position of the foam for each of the injection paths used.

Figure 5 shows final foam position from the violet pouring path presented in Figure 4. The simulation shows a very good qualitative agreement with the experiments regarding the top and bottom view. After the foam was removed from the mold, the cushion was cut into slices. This allowed us to make a further comparison between simulation and experimental results.
FOAM has proven its ability as a simulation tool for predicting foam flow expansion in complex domains. It allows testing for a different injections paths and correct vent positioning at early design stages. It can reduce the number of experimental trials, the underlying time and cost.


