Visualization

For many years, the Competence Center High Performance Computing has been working on advancing 3D visualization off the beaten path, by using CPUs exclusively and omitting the GPU altogether. This, together with the parallel design, fast communication methods between the nodes, and scalable render kernels, sets the PV-4D render engine apart from anything else on the market. With these features, the PV-4D engine is perfectly suited for interactive visualization of all kinds of large scale datasets as found in all kinds of industries, from seismic through medicine over filming and gaming on to automotive. The capabilities and possibilities of the engine are virtually endless: It allows visualizing volume datasets like seismic surveys or MRI imagery with or without volume rendering, efficiently renders large triangulated objects and scenes, or creates photo-realistic images from scenes using HDR environment maps for lighting, thus creating completely new scenarios for its use.


Scientist of the visualization group at CC HPC are continuously developing new optimization strategies and methods to stay ahead any competition and keep creating cutting edge technologies. The ever increasing computational power of new hardware, including new architectures like Intel's KNL, makes it possible to regularly provide more compute intensive methods for interactive visualization or large scale datasets.

Photo-realistic images with path tracing

The integration of path tracing algorithms into PV-4D marks the next evolutionary step in photorealistic rendering, after interactive ray tracing has been available for a while now. As opposed to ray tracing, path tracing also illuminates diffuse surfaces correctly, generating much more realistic lighting effects. The better image comes at a cost, however. To create an image with little to no noise, the number of rays that have to be traced and tested against the objects in the scene has to be relatively high.

This requires state-of-the-art methods to create and update the so called bounding volume hierarchies (BVHs), and to test rays against those BVHs and the objects they contain. Researchers work on new and efficient algorithms for both these tasks and could already publish two algorithms for BVH traversal, one for coherent and one for incoherent rays. Measured against other solutions, such as Intel Embree, these algorithms are already faster by a factor of 2 to 4. The ultimate goal of the team is nothing less but being able to interactively render whole movies, provided there’s enough compute power available. Fast methods for BVH construction and update also open new possibilities for visualizing particle simulations. The method of choice for this right now is to pre-calculate those image by image and put together a video clip from those images. This method, however, limits the viewer to one single point of view. With Fraunhofer’s technology, interactive visualization of such scene is possible and allows completely new insights.

XtreemView Visualisierung
© ITWM
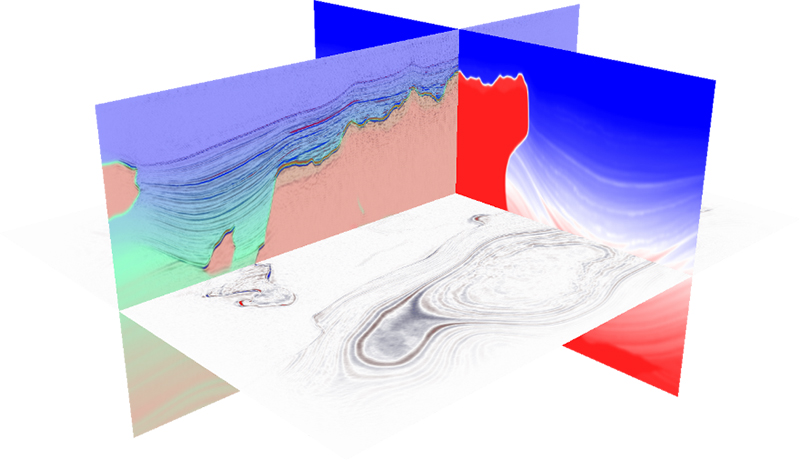
XtreemView allows to select arbitrary paths in the dataset and map the volume data onto those planes.

XtreemView

Leveraging the Fraunhofer internal concept of “Intrapreneurship”, a startup was formed within the department to push efforts on this commercial track. This startup is partly funded by the “Fraunhofer-Innovator” program which has the mission to methodically support technology projects with the transition from research to the creation of a market ready product. Its ultimate goal is to make the technology available to the market, either by licensing or by forming spin-offs.

Leveraging the long standing engagement of the CC HPC in the oil and gas market, the first phase of this commercial path is targeting this market and offers – besides the actual PV-4D engine – a new and lightweight viewer for seismic data, which is fast, parallel, and easy to use: XtreemView.

XtreemView brings the strengths of the PV-4D engine right to the end user. It’s simple and easy to user interface make it a great tool, whether used daily or just occasionally.

Using the full 32-bit float values for visualizing the data allows working with real amplitudes, and seamlessly blending two arbitrary volumes, like seismic and a velocity field, delivers an extra layer of information. This little extra can be critical when it comes to interpretation and analyzation of datasets. Different ways of displaying the same volume, together with volume rendering, the addition of multiple seismic horizons, as well as being able to define arbitrary planes make a well-rounded visualization tool for even seasoned users.

The most important advantage of XtreemView is its scalability which allows to match the hardware to the problem size and not vice versa. Not only can two compute nodes visualize twice the data, because all I/O operations are also implemented in parallel, data loading is no longer the hurdle it used to be. Adding more nodes drastically reduces loading times from industry standard formats such as SEGY, JavaSeis, SU, and others. XtreemView was presented on both big industry shows, EAGE in Paris and SEG in New Orleans and hit the spot with users and visitors alike.