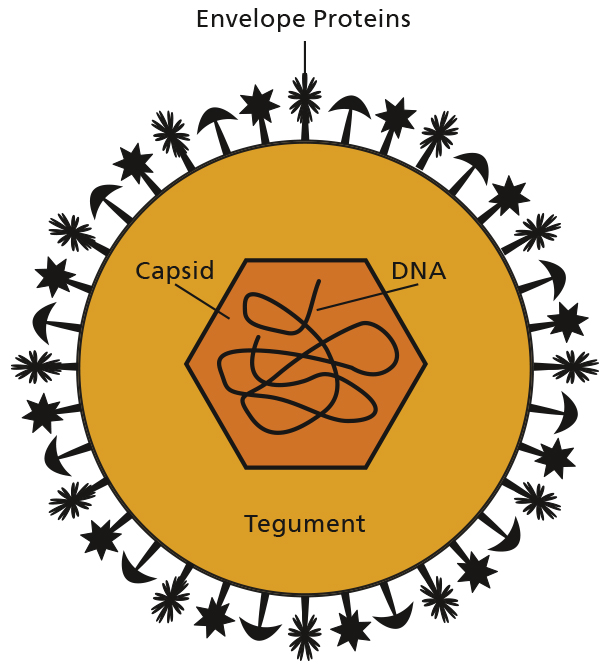
Clinical studies with first generation oncolytic (cancer destroying) viruses are very promising. To ensure this new approach is available to all patients, we develop scalable and robust production methods for these viruses. As part of the Fraunhofer-Gesellschaft, our experts are researching these issues using mathematical methods within the framework of project TheraVision.
TheraVision – How to Grow Therapeutic Viruses
Project TheraVision: Viruses in Tumor Therapy
When to Infect and When to Extract?
Preparation of the viruses consists of an upstream and a downstream process. Initially, special host cells are grown in the upstream process. At a certain time, these are infected with the virus. From this moment on, the viruses multiply in the host cells until the cells are destroyed and the viruses produced escape into the surrounding nutrient solution. After a certain period of time, the nutrient solution is extracted and fed into the downstream process where the virus is filtered
out.
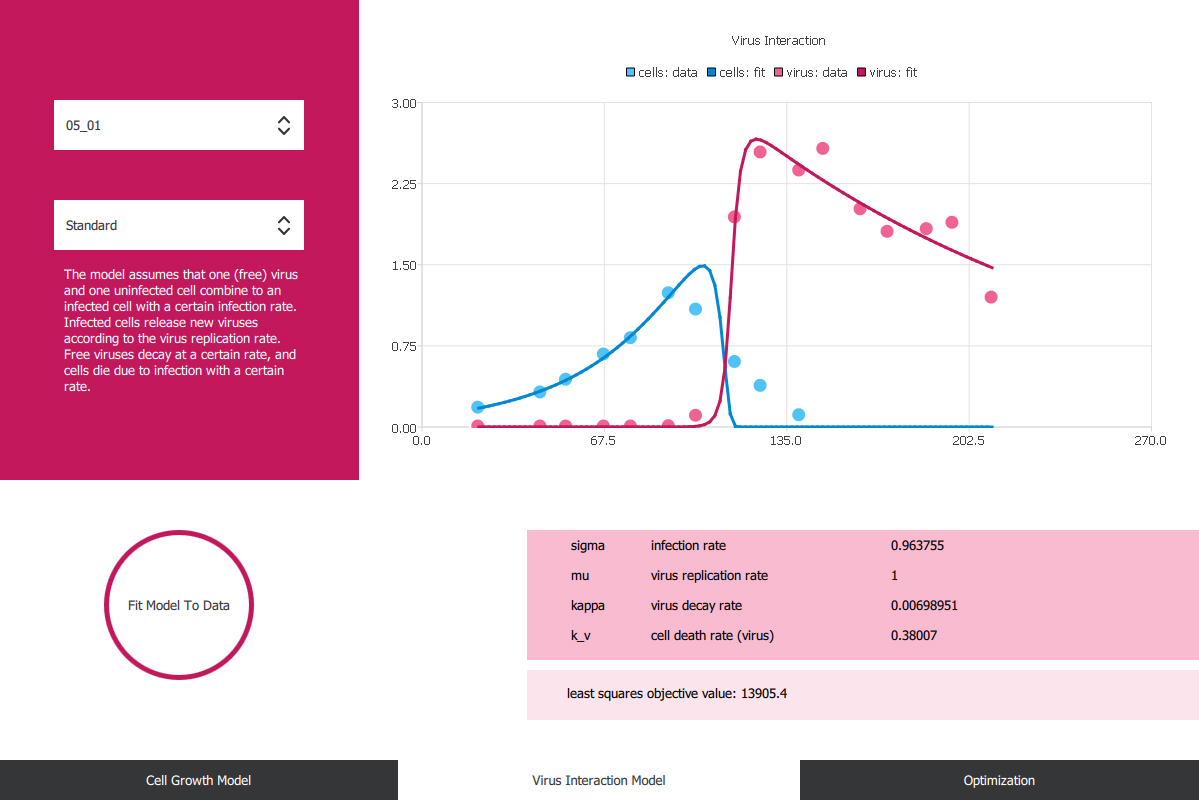
The aim of our project is a model-based optimization of the upstream process using experimental data. We have prepared a model that represents the cell and the growth of the virus as a function of controllable variables. The first variables to be optimized on the basis of the model are the infection and extraction points.
Parameter Estimates and Compromises
The model we use is a parameterized system of ordinary differential equations. Aided by the use of statistical methods (parameter estimation), we have identified the variables (growth and death rates) such that the model closely matches the experiments conducted at Fraunhofer Institute for Toxicology and Experimental Medicine ITEM. When the model is constructed in this way, the optimal time of infection and extraction is determined using a special optimization method (multiple shooting).
The focus is on several target aspects:
- the maximal achievable number of viruses
- the effectiveness
- the purity of the extracted solution

These aspects are either individually optimized or an optimally balanced compromise is sought between the targets (multi-criteria optimization).
Project Partner
- Fraunhofer Institute for Toxicology and Experimental Medicine ITEM
- Fraunhofer Institute for Interfacial Engineering and Biotechnology IGB
- Fraunhofer Institute for Silicate Research ISC
- Fraunhofer Institute for Cell Therapy and Immunology IZI
Project Duration
April 2017 – March 2020


